How to Measure Fitness Progress Accurately


Accurate fitness progress measurement is defined as tracking multiple physical markers, including body circumference, strength output, resting heart rate, and recovery quality, consistently over time to detect real change. Relying on a single number, like scale weight, produces misleading results because it captures only one dimension of a complex physical system. The American College of Sports Medicine (ACSM) and exercise science research both confirm that a multidimensional approach is the most reliable way to measure fitness progress accurately. This article covers the exact metrics, tools, and protocols that reduce data noise and give you a clear picture of where you stand.
Which fitness metrics provide the most accurate progress tracking?
The most accurate fitness tracking combines at least four categories of markers: body composition, strength, cardiovascular fitness, and recovery. Each category captures a different dimension of physical change. No single metric tells the full story.
Body composition measurements
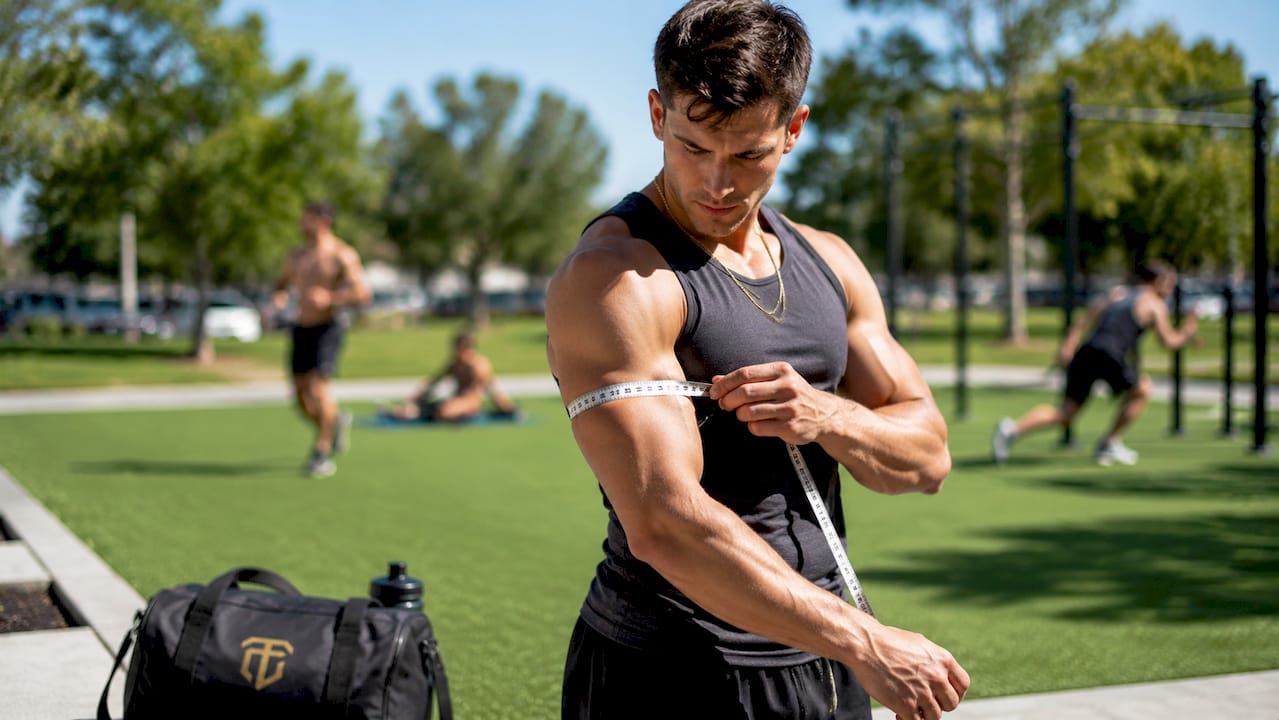
Body circumference measurements at the waist, hips, arms, and thighs reflect fat loss and muscle gain better than scale weight alone. A tape measure applied consistently at the same anatomical landmarks, at the same time of day, gives you reliable trend data over weeks. The scale can stay flat while your waist shrinks, which is exactly why body composition measurements matter more for most fitness goals.
Strength metrics
Strength progress is best tracked through workout logs that record sets, reps, and load over time. A more sensitive method is velocity-based training (VBT), which measures how fast you move a barbell at a fixed sub-maximal load. Bar velocity tracking detects strength changes of 2–3%, which is far more sensitive than waiting for a new one-rep maximum. A velocity increase of 0.03–0.05 m/s at a fixed load corresponds to roughly a 5% increase in estimated strength. That level of sensitivity lets you spot progress weeks before a traditional max test would show anything.
Cardiovascular markers
Resting heart rate (RHR) is a low-cost, high-value cardiovascular marker. Well-trained adults typically show an RHR between 40 and 60 beats per minute, compared to the general population average of 60–100 bpm. A declining RHR over weeks signals improving cardiovascular efficiency. Field tests like the 1.5-mile run or the 3-minute step test also provide reliable cardiovascular benchmarks without lab equipment.
Recovery indicators
Recovery quality rounds out the picture. Sleep duration, perceived energy on waking, and subjective readiness scores all reflect how well your body is adapting to training. The Borg Rate of Perceived Exertion scale and simple daily energy ratings complement objective data and help you catch overtraining before it derails progress.
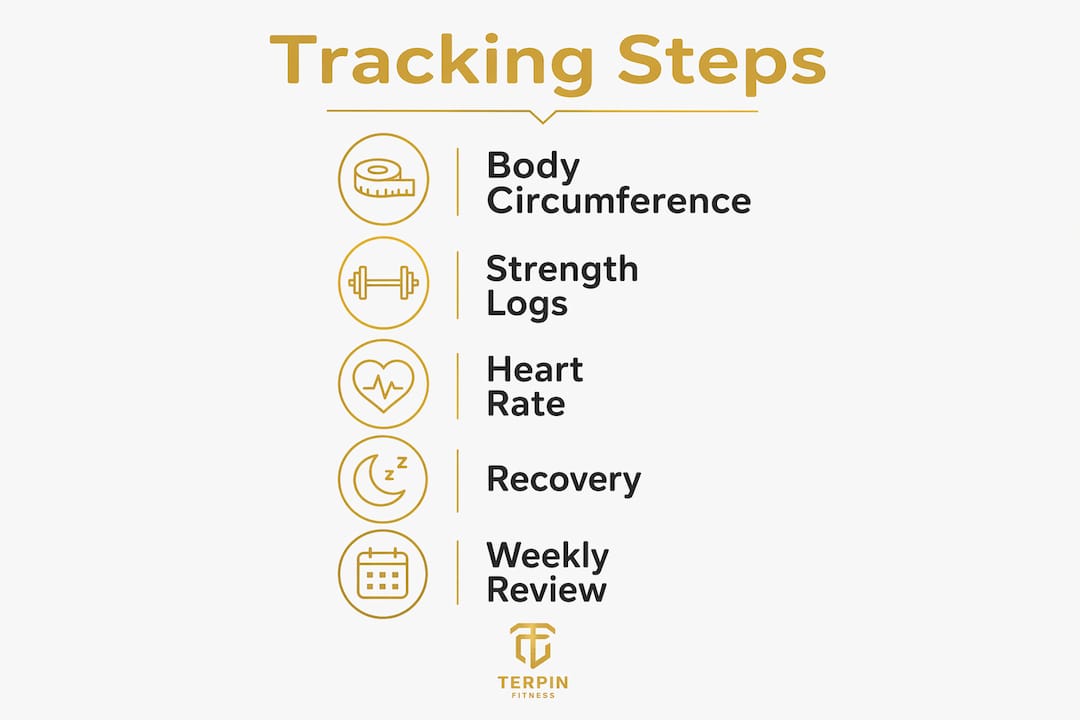
Pro Tip: Track at least one metric from each category every week. If three out of four categories show improvement, your program is working, even if the scale hasn’t moved.
What tools and protocols ensure consistent fitness tracking?
Consistency in measurement conditions is what separates real progress data from noise. The same metric measured under different conditions on different days produces numbers that cannot be compared.
Here is a protocol that eliminates the most common sources of error:
Measure body circumferences first thing in the morning, before eating or drinking. Use a flexible tape measure and mark the exact anatomical location with a small skin-safe marker the first time. Repeat at the same spot every session.
Record resting heart rate immediately after waking, before getting out of bed. Count beats for 60 seconds or count for 30 seconds and multiply by two. Log the number alongside the date.
Track strength at fixed sub-maximal loads, not at maximal effort every session. Choose a load you can lift for 5–8 reps and record bar speed or rep count at that load weekly.
Take progress photos under identical conditions: same room, same lighting, same time of day, same clothing. Photos taken in consistent conditions allow side-by-side visual comparison that reveals changes the tape measure misses.
Reassess all metrics on a scheduled cycle. ACSM guidelines recommend reassessment every 4–12 weeks depending on the metric and training phase. Shorter cycles suit strength and cardiovascular markers; longer cycles suit body composition.
Pro Tip: Set a recurring calendar reminder for your measurement day. Treat it like a workout appointment. Skipping it breaks the data chain and makes trend analysis unreliable.
The table below summarizes the recommended tools and timing for each metric category.
Metric | Tool | Measurement timing | Reassessment frequency |
Body circumference | Flexible tape measure | Morning, fasted | Every 4–6 weeks |
Strength output | Workout log or VBT device | Before fatigue accumulates | Every 1–2 weeks |
Resting heart rate | Watch or manual count | Immediately upon waking | Weekly |
Progress photos | Smartphone camera | Morning, consistent conditions | Every 4–6 weeks |
Perceived recovery | Borg RPE or 1–10 scale | Post-waking, pre-workout | Daily or weekly average |
One tool worth avoiding for body fat tracking is the home-use bioelectrical impedance scale. Home bioimpedance scales are frequently unreliable because hydration level, recent food intake, and skin temperature all shift the reading by several percentage points. A tape measure or a clinical DEXA scan gives you far better data.
How do you combine multiple fitness indicators for a full progress picture?
A multidimensional scorecard is the most reliable way to monitor workout results over time. Tracking strength, endurance, recovery, and body composition together reduces the frustration that comes from fixating on one number. Experts advocate this approach because it captures the full range of physical adaptation and keeps motivation high when one metric temporarily stalls.
A practical scorecard setup looks like this:
Workout log: records load, sets, reps, and bar speed for two to three key lifts each week
Measurement journal: logs waist, hip, and arm circumferences on a fixed schedule
Cardiovascular log: tracks RHR and a monthly field test result like a timed mile
Recovery log: records sleep hours and a daily readiness score from 1 to 10
Photo folder: organized by date for visual comparison every four to six weeks
The most common mistake with multidimensional tracking is checking every metric daily. Daily measurements introduce noise from hydration, sleep, stress, and hormonal cycles. The data becomes unreadable. Weekly or bi-weekly trends reveal real change; daily snapshots mostly reveal biology doing its normal job.
Interpreting trends over four to eight weeks gives you the signal. A waist measurement that drops 0.5 inches over six weeks while your bench press velocity increases and your RHR drops by four beats per minute tells a clear story. That story is invisible if you only check the scale each morning.
Combining subjective readiness scores with objective markers also catches problems early. If your strength numbers plateau and your recovery scores drop simultaneously, that pattern points to under-recovery, not a failed program. Knowing the difference saves weeks of wasted effort. For more on building a system that keeps you consistent, the guide on accountability fitness routines covers the structural side of staying on track.
What are the most common fitness tracking mistakes?
The most damaging tracking mistakes share one root cause: inconsistency. Inconsistent timing, inconsistent tools, and inconsistent metric selection all produce data that cannot be trusted.
The most common errors are:
Measuring too often. Checking body weight or circumferences daily creates anxiety without insight. Fluctuations of 1–3 pounds within a single day are normal and reflect water, food volume, and digestive content, not fat change.
Changing measurement conditions. Measuring your waist after dinner one week and before breakfast the next makes the numbers incomparable. Consistent timing before eating or drinking is the standard that removes this variable.
Trusting home bioimpedance for body fat. As noted above, these devices shift readings based on hydration. A person who drinks an extra liter of water before stepping on the scale will see a meaningfully different body fat percentage, even though nothing about their body composition changed.
Ignoring strength and performance markers. Many people on weight loss programs track only the scale and circumferences. Strength gains are a direct sign that your body is building or preserving muscle, which matters for long-term metabolic health.
Keeping no written record. Memory is unreliable over months. A simple notebook or spreadsheet creates the data trail that makes trend analysis possible.
“The goal of tracking is not to judge yourself daily. It is to collect enough consistent data points over weeks that the trend becomes undeniable. Patience with the process is what separates people who see results from people who quit.”
Field tests like the 1.5-mile run and circumference measurements are sufficient for general tracking when protocols stay consistent. You do not need lab equipment to get reliable data. You need discipline in how and when you collect it.
Key Takeaways
Accurate fitness tracking requires consistent protocols across multiple metric categories, not just a single number checked daily.
Point | Details |
Use multiple metrics | Track body circumference, strength, resting heart rate, and recovery together for a reliable picture. |
Standardize conditions | Measure first thing in the morning, fasted, under the same conditions every session. |
Follow ACSM reassessment cycles | Reassess every 4–12 weeks depending on the metric to distinguish real change from daily noise. |
Avoid home bioimpedance scales | Use a tape measure or clinical scan for body composition; bioimpedance readings shift with hydration. |
Read trends, not snapshots | Interpret data over four to eight weeks; daily fluctuations reflect normal physiology, not progress or failure. |
What I’ve learned from years of tracking fitness progress
The biggest shift I made in how I think about fitness assessment came when I stopped treating the scale as a progress report. I started using it as one data point among six, and everything became clearer. Clients at Terpinfit who track strength velocity alongside circumferences and recovery scores almost always stay motivated longer, because they can see progress in at least one category even during weeks when the scale sits still.
Velocity-based strength tracking changed how I coach entirely. When a client’s bar speed at a fixed load increases week over week, I know the program is working before any visual change appears. That early signal is worth more than any before-and-after photo because it tells me what to do next, not just what already happened.
The subjective side matters more than most people admit. Energy levels, sleep quality, and how hard a workout feels at a given load are real data. I log perceived readiness scores for every client, and those scores have predicted plateaus and overtraining episodes weeks before objective numbers confirmed the problem. For anyone serious about staying motivated through the inevitable flat weeks, subjective tracking is the tool that keeps the bigger picture visible.
My honest advice: pick five metrics, measure them consistently, and read the trend at six weeks. If you do that without changing the protocol, you will have more useful fitness data than most people collect in a year.
— Marc
Terpinfit’s approach to tracking your fitness results
Knowing what to track is one thing. Having a coach who builds the measurement system around your specific goals is another.

At Terpinfit, every client starts with a structured fitness assessment that establishes baseline numbers across body composition, strength, and cardiovascular markers. From there, the program is built around those baselines, with scheduled reassessments built into the training cycle. Whether you work with Terpinfit online or in person in Pensacola, Florida, your progress gets tracked the right way, with multiple metrics, consistent protocols, and a coach who interprets the data with you. If you are ready to stop guessing and start seeing clear results, Terpinfit personal training is the place to start.
FAQ
How often should I measure my fitness progress?
ACSM guidelines recommend reassessing fitness metrics every 4–12 weeks depending on the category. Strength markers can be tracked weekly, while body composition measurements are most reliable on a four to six week cycle.
Is scale weight a reliable way to track fitness progress?
Scale weight alone is not a reliable fitness progress indicator because it does not distinguish between fat, muscle, water, and food volume. Combining it with body circumference measurements and strength logs gives a far more accurate picture.
What is the best time of day to take body measurements?
First thing in the morning before eating or drinking is the standard measurement time. Consistent morning timing removes the variability caused by hydration, food intake, and daily physiological shifts.
What is velocity-based training and why does it matter for tracking?
Velocity-based training measures how fast you move a barbell at a fixed sub-maximal load. It detects strength changes of 2–3%, making it a more sensitive progress indicator than waiting for a new one-rep maximum.
Can I track fitness progress without expensive equipment?
Yes. A flexible tape measure, a notebook, a smartphone camera, and a watch for counting resting heart rate are sufficient for accurate tracking. Field tests like the 1.5-mile run and circumference measurements match lab-level reliability when protocols stay consistent.
Recommended
Comments